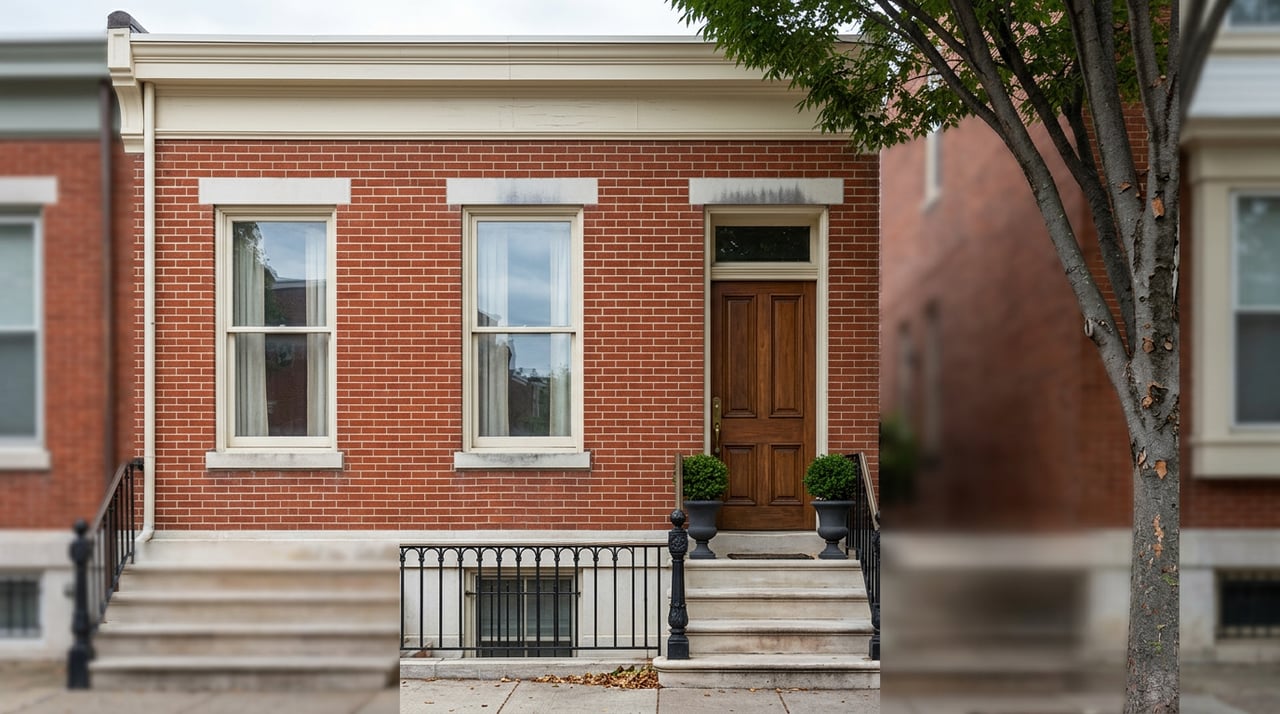
Hoboken Neighborhood Price Trends: Why Medians Can Mislead
September 17, 2026
September 17, 2026
How does a neighborhood post its highest sale price in city history and a falling median in the same stretch of months? In April 2026, a unit at 1500 Hudson Street, inside the Hudson Tea Building, closed for $4.75 million, the most ever paid for a Hoboken condo, edging out the $4.65 million record the same building set back in 2022. Meanwhile, the tract of Hoboken that contains that building, the waterfront corridor running through Maxwell Place, Hudson Tea, and the blocks north of downtown, showed a median sale price down 6.7% and a price per square foot down 4.5% for the three months ending in May 2026, according to closed-sale data compiled from local MLS records.
Both numbers are real. Neither one is lying. What they reveal, once you sit with them, is that a neighborhood-level median in a market as small as Hoboken can tell you almost nothing about whether that neighborhood is actually gaining or losing value. It tells you what happened to close on a short list of properties in a short window. That distinction matters a great deal if you're comparing Hoboken pockets before you buy, and it's the kind of friction that doesn't show up until you start asking why the numbers don't match the story everyone assumes is true.
The waterfront tract north of downtown Hoboken, sometimes labeled North East Hoboken in neighborhood-level data, is where the city's marquee buildings sit: Maxwell Place, the Hudson Tea Building, 1500 Hudson Street. These are the addresses with 24-hour concierge, Hudson River views, and price tags that regularly clear seven figures. It is also, in Hoboken terms, a small market. In May 2026 alone, 32 homes sold in this tract. Compare that to the roughly 173 homes that sold across the entire city in June 2026, and you start to see the problem. A tract that thin can have its median moved by a handful of transactions that have nothing to do with each other.
A separate market report on Hoboken's luxury segment, covering conditions as of March 2026, put a number on the supply side of this story: inventory for homes priced above $1.5 million was down 23.3% year over year, even as buyer demand for that tier held at multi-year highs. Low supply and steady demand should produce rising prices, and at the level of an individual trophy sale, that's exactly what happened at Hudson Tea. But when a tract has few enough closings, the mix of what happens to sell in a given quarter, three modest interior-facing resales instead of two big view-corridor units, can drag a median down even while the ceiling for that same building keeps climbing.
Look at how differently Hoboken's four MLS submarkets behaved over roughly the same stretch of 2026:
Read as a group, these numbers aren't describing four neighborhoods drifting apart in desirability. They're describing four different supply pipelines. Downtown and Southwest are absorbing new construction that's changing what "typical" looks like in the comp set. The waterfront tract isn't seeing much new supply at all, so its median swings on the composition of a small number of resales rather than any shift in what buyers will pay for the addresses that matter most.
This is the part that trips up buyers who are used to reading national housing data, where sample sizes are large enough that a median behaves the way you'd expect. Hoboken is one square mile. Its most expensive tract sells roughly ten homes a month. When a market is that small, a single busy month for penthouse trades followed by a quiet month for penthouse trades will move the median far more than any real change in what the building is worth.
The record sale at 1500 Hudson Street is the clearest evidence that the waterfront hasn't actually softened. A seller in that building found a buyer willing to pay more than anyone ever had for a Hoboken condo, in the same window that the tract's median was reported as falling. If you're comparing Hoboken pockets by median price alone, that's the trap. The median is a snapshot of whoever happened to close, not a referendum on the neighborhood.
Southwest Hoboken's 26.3% gain has a much simpler explanation: new supply is arriving, and it's arriving at price points that pull the neighborhood's comp set upward. The city adopted the Southwest Hoboken Redevelopment Plan back in 2017, and the pipeline it set in motion is now delivering. Southend Lofts, a 110-unit mixed-use project at 38 Jackson Street with an early childhood education center built in, was nearing completion as of May 2026. The Boundary, three mixed-use buildings approved for JDA Group in the same redevelopment zone, was part of the same pipeline, adding residences, office and event space, and an elevated public park to the neighborhood. The Taurasi Group's Southwest Market overhaul, which gained final approval in 2022, is bringing a supermarket, retail, and condominiums into a renovated historic factory, another piece of the same multi-year buildout.
The city has also been investing in the infrastructure around this growth. A Vision Zero traffic and safety project in Southwest Hoboken added multi-way stops and signal upgrades at several intersections, and despite a 15% increase in traffic volume since 2019, those changes have cut vehicular travel times by as much as 40%. None of this is incidental to the price data. When a neighborhood adds this much new product and this much public investment at once, the units that sell there stop looking like the neighborhood's old housing stock and start looking like a different, pricier category of home. That's a real shift in what Southwest Hoboken offers, not a statistical illusion, and it's worth distinguishing from the waterfront tract's more mechanical swings. Southwest Fest, the neighborhood's own summer block party, held its fourth annual run on Jackson Street between 2nd and 4th Streets this past June, a sign of a neighborhood coming into its own identity alongside the construction cranes.
Downtown's 47.2% jump has a similar root cause. Historic brownstones have always anchored this part of the city, but new residential towers are now part of the comp set too. Charlie, a 27-story tower near the Hoboken Terminal on Observer Highway, is adding 386 units to the neighborhood, a fifth of them designated affordable, along with what's reported to be the largest residential geothermal system in New Jersey. When a tower of that size enters a neighborhood that used to be defined by walk-up brownstones, the median for that neighborhood absorbs a wave of new, differently priced product much faster than the old housing stock could move it on its own.
If you're relocating to Hoboken or sizing up where an investment dollar goes further, the headline neighborhood median is the least useful number on the page. A few questions do more work than the topline stat:
How many homes actually closed in that tract over the period being quoted. If the answer is under 40, treat the median as directional at best.
What's currently under construction or recently delivered nearby. A neighborhood absorbing new supply will show price movement that has more to do with the new units than with the existing housing stock gaining or losing value.
Whether the number reflects a full year or a single quarter. Hoboken's submarkets are small enough that quarter to quarter swings can look dramatic without meaning much over a longer hold.
None of this means the waterfront corridor is a bad buy or that Southwest Hoboken is overheating. It means the two tracts are telling different stories for different reasons, and a buyer who understands which story applies to which pocket is in a much better position to negotiate, time an offer, or set realistic expectations for appreciation.
Does a falling median mean the waterfront tract is losing value? Not on its own. With around 32 closings in a single month and a record-setting sale in the same stretch, the drop is more consistent with a thin, low-volume market than with any softening in what buyers will pay for the addresses that matter most.
Is Southwest Hoboken's growth sustainable, or is it a temporary construction bump? The Southwest Hoboken Redevelopment Plan has been in place since 2017, and multiple projects, including Southend Lofts and The Boundary, are still working through the pipeline. That suggests the shift in the neighborhood's comp set is ongoing rather than a one-time event.
How should I compare Hoboken pockets if I'm deciding where to buy? Look past the median to the sales count behind it and to what's currently under construction nearby. A tract with thin volume and no new supply will read very differently from one absorbing hundreds of new units, even if both post double-digit percentage moves.
Numbers like these are exactly why a market this small rewards a second look before a decision. If you're weighing a purchase in Hoboken's waterfront corridor, Southwest, or anywhere else in Hudson County, The Mumoli Collective can walk you through what's actually driving the comps on your specific block, building by building, before you make an offer based on a citywide average that doesn't apply to it.
Stay up to date on the latest real estate trends.

Private real estate advisory for New Jersey’s most discerning clients. Specializing in luxury homes, new developments, and condo conversions across Jersey City, Hoboken, Weehawken, and the NJ Suburbs.